What is Trading Volume?
A trading volume for 24 hours is an important indicator that can give information about the activity of traders on a particular coin. Unlike open interest, which in real time shows the number of open positions, the volume of bidding is considered to be already made transactions.
Also, this indicator gives information about the liquidity of the asset — this means that active auction is on the coin. Coins with large volumes are more resistant to manipulations and their price is considered more fair.
What affects the volume of trading?
Often, the news background affects a sharp change in volume when, when some events, traders begin to actively trade a coin. There is a surge of volumes, that is, closed transactions of purchase or sale, which is already beginning to influence the cost.
Also, an indicator of volumes can often be manipulated to «pump» the price. Large buyers begin to actively trade in a coin, making quick purchases and sales transactions, showing an increase in volume. Other traders, seeing a high turn and an ascending price trend, also begin to enter the asset. But at a certain point, when the price is reached a certain level (or seeing that the growth rate begins to decline), a large player closes his position, which sharply reduces the cost. Therefore, it is important to analyze the trade volume along with other indicators in order to avoid such manipulations,
Types of volume representation
There are three main types of volume representation used in analysis: vertical, horizontal and cluster. Each of them shows the distribution of volumes relative to price or time period.
Vertical volume
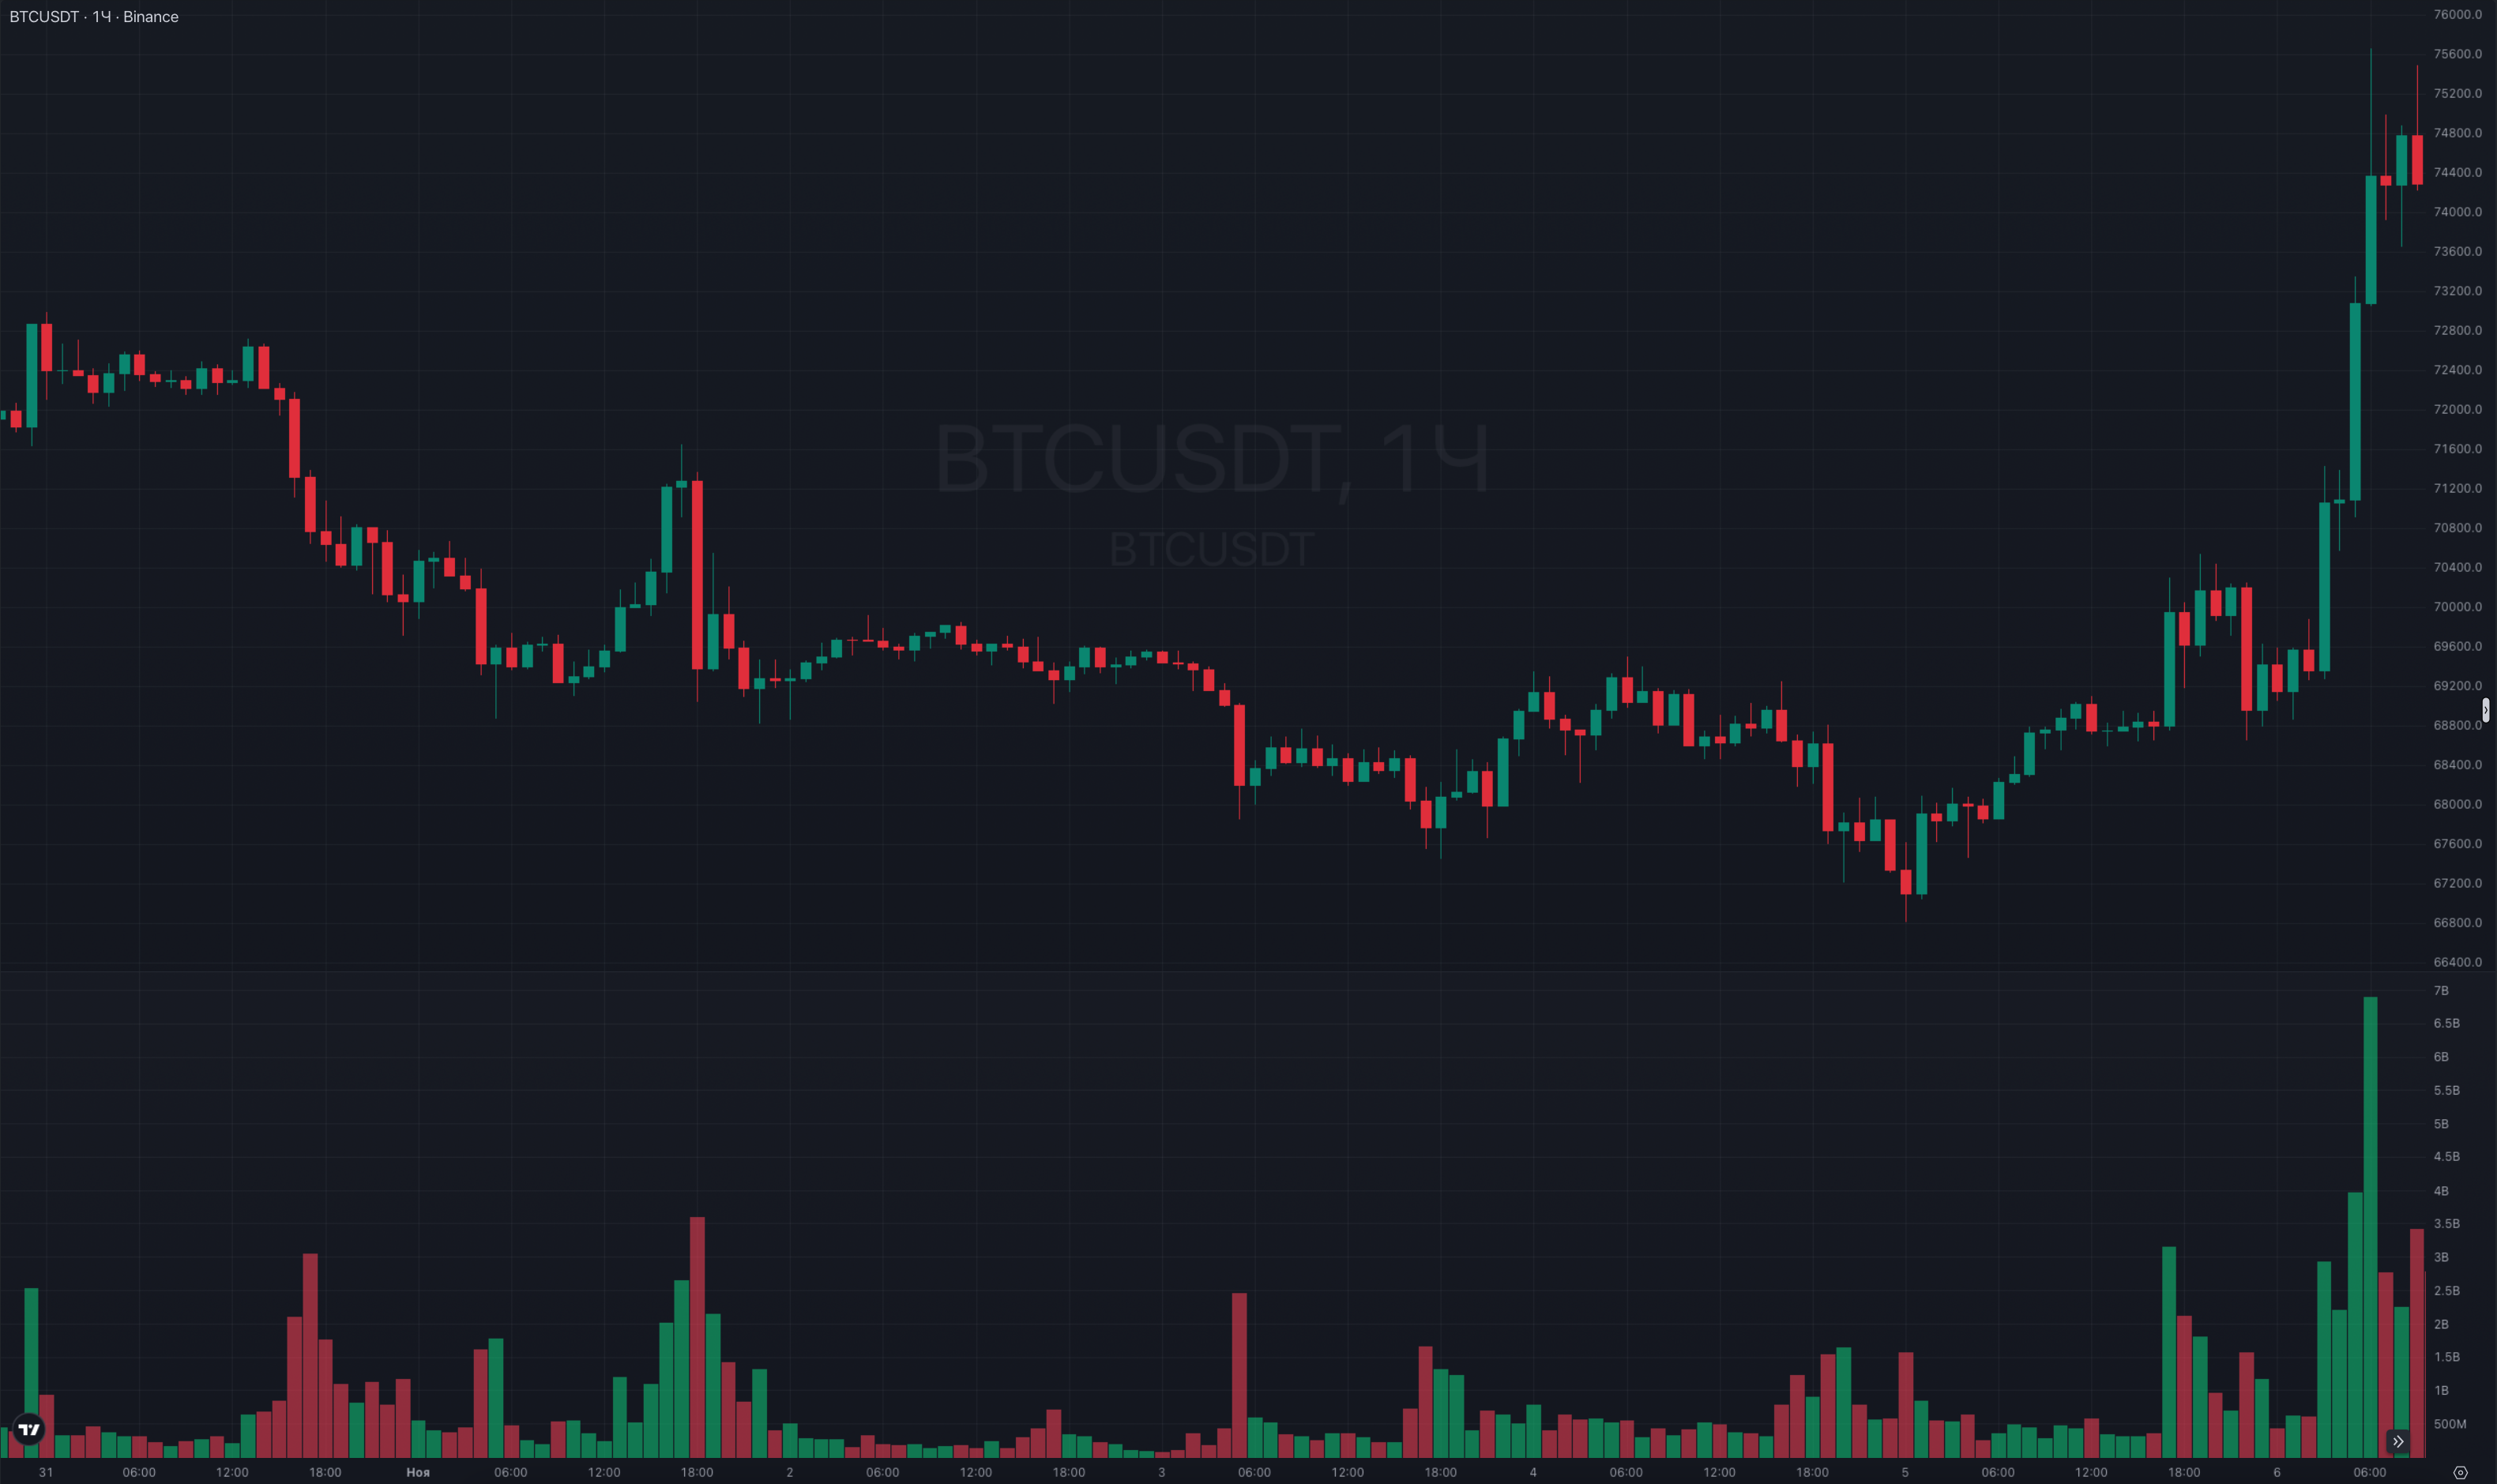
The vertical volume is the value of the number of transactions tied to a certain period of time. This is the main type of volume, which is often shown on the graphs along with the price.
Horizontal volume
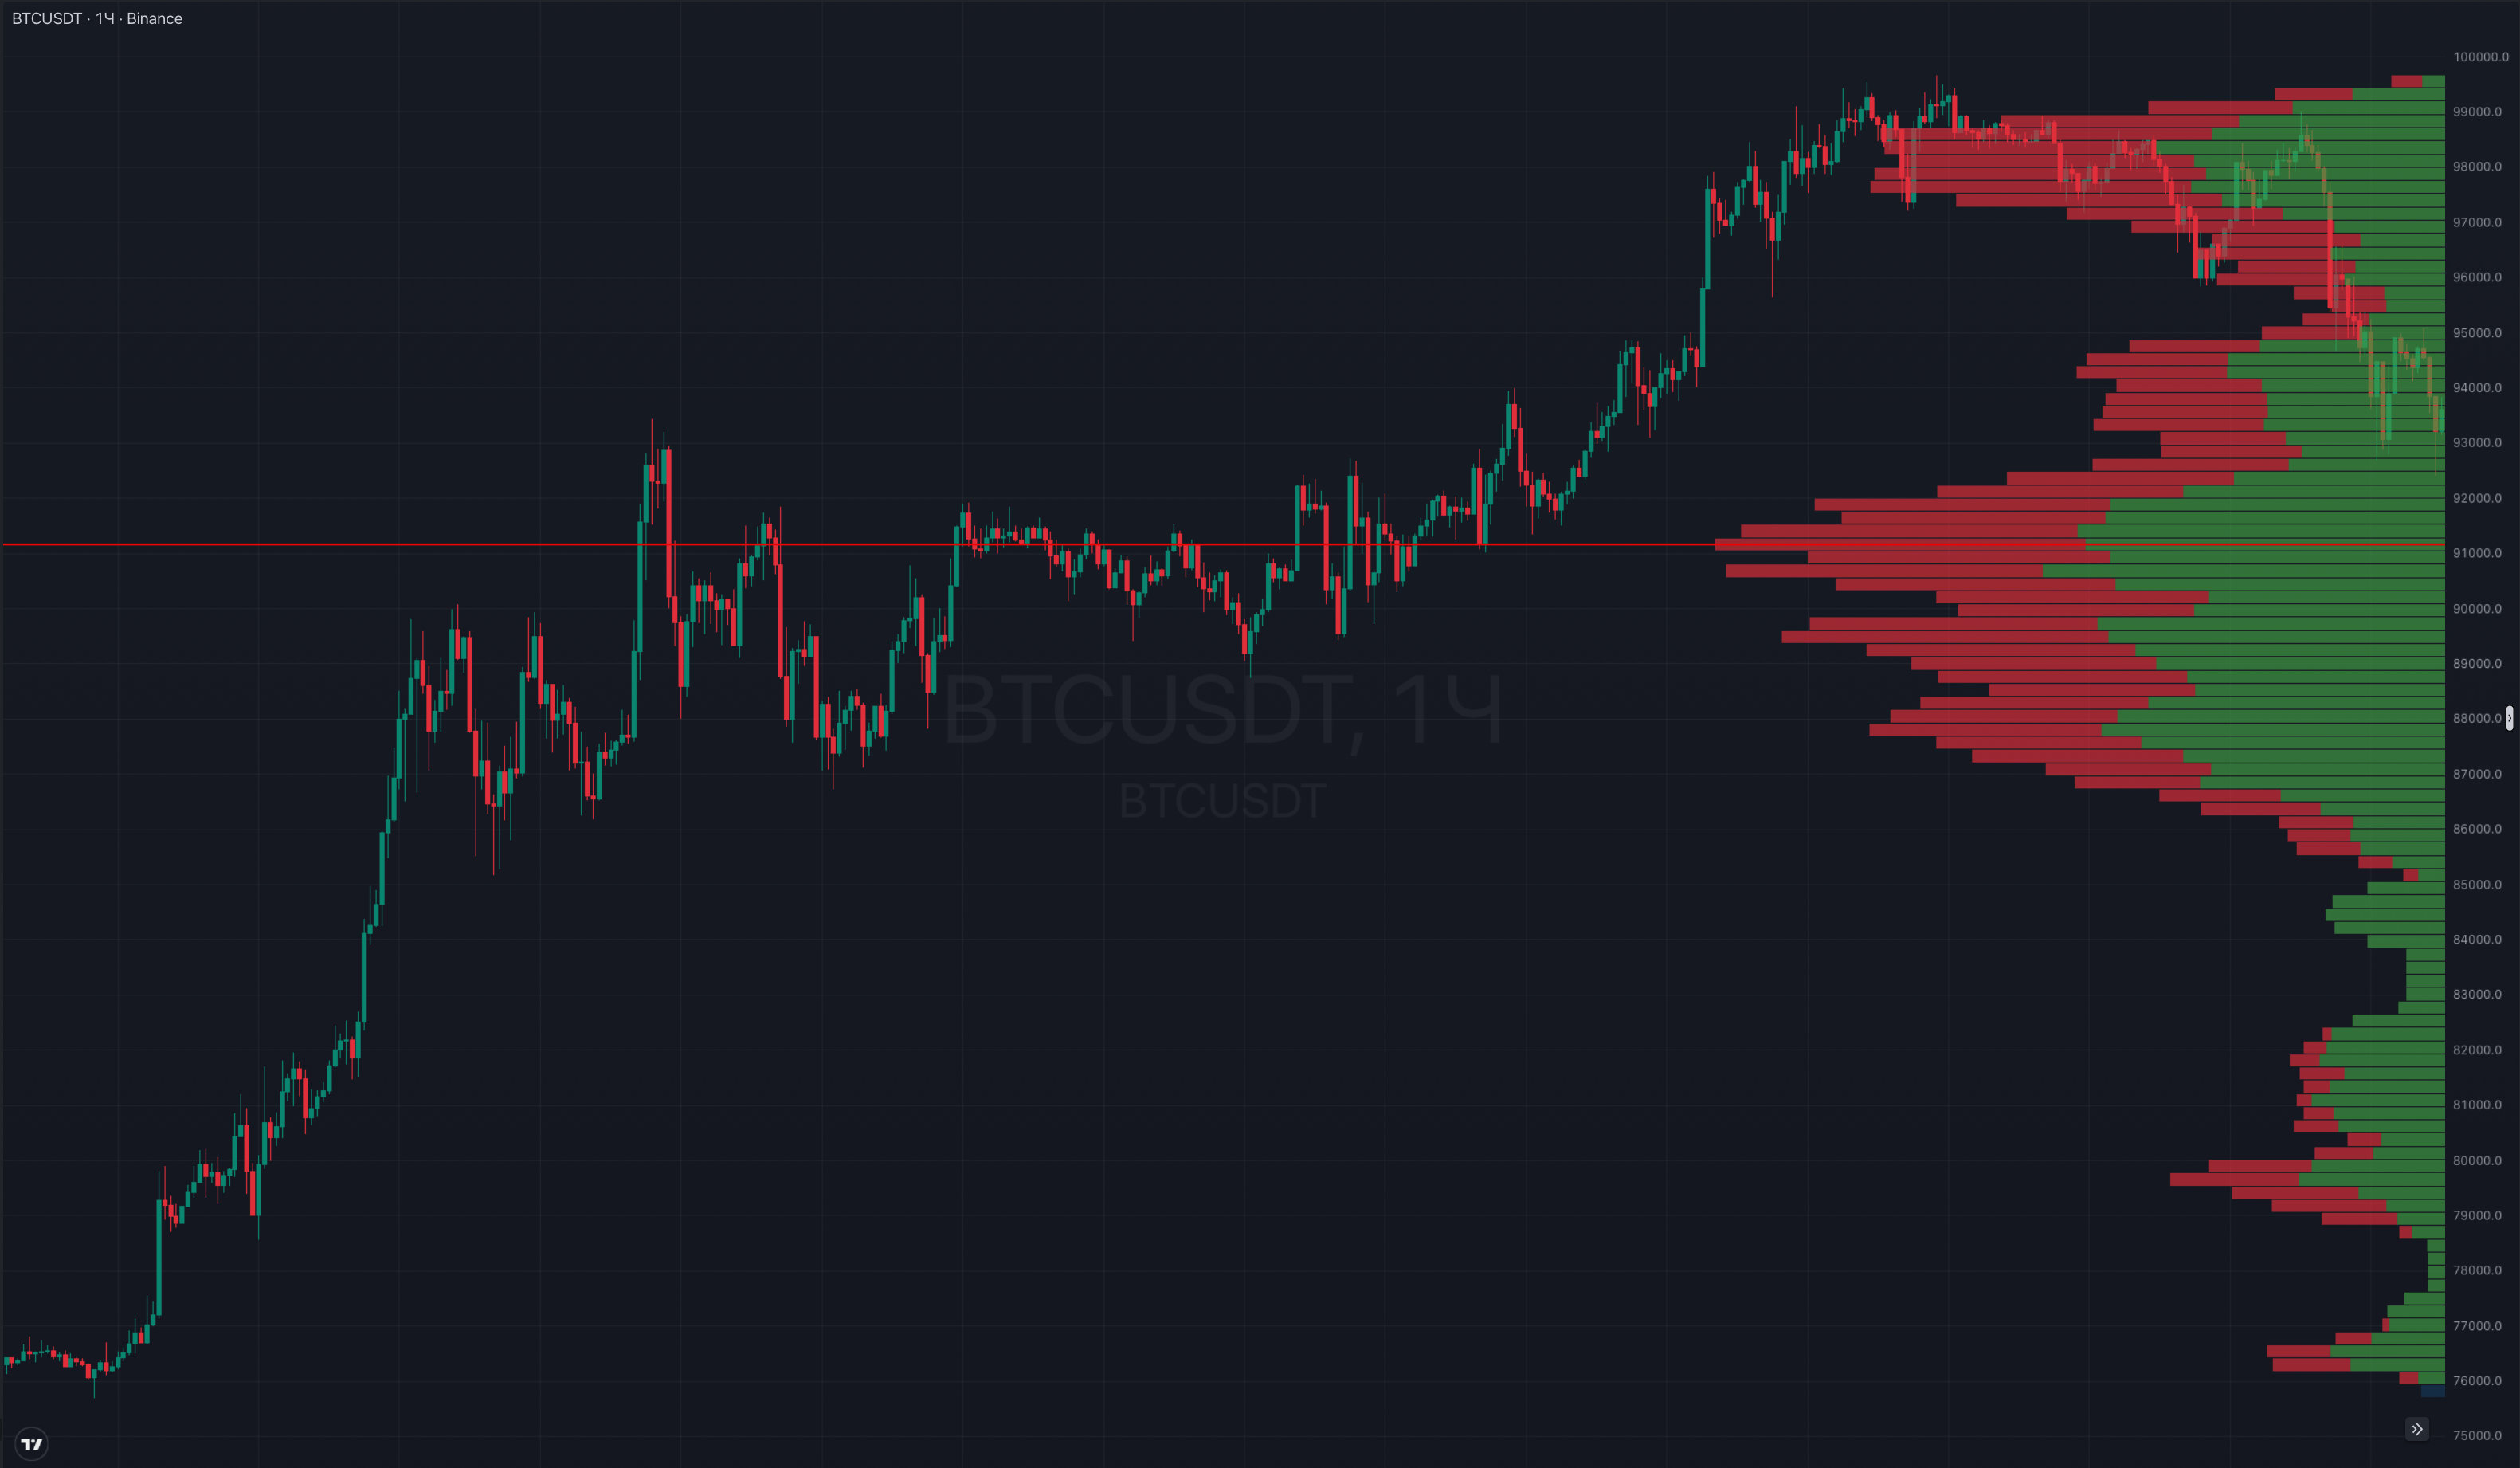
A horizontal volume is an indicator of volume tied to a price level. This indicator shows interest in a certain cost and shows the stability of price levels. Such an indicator is often used in the analysis of support and resistance levels.
Cluster volume
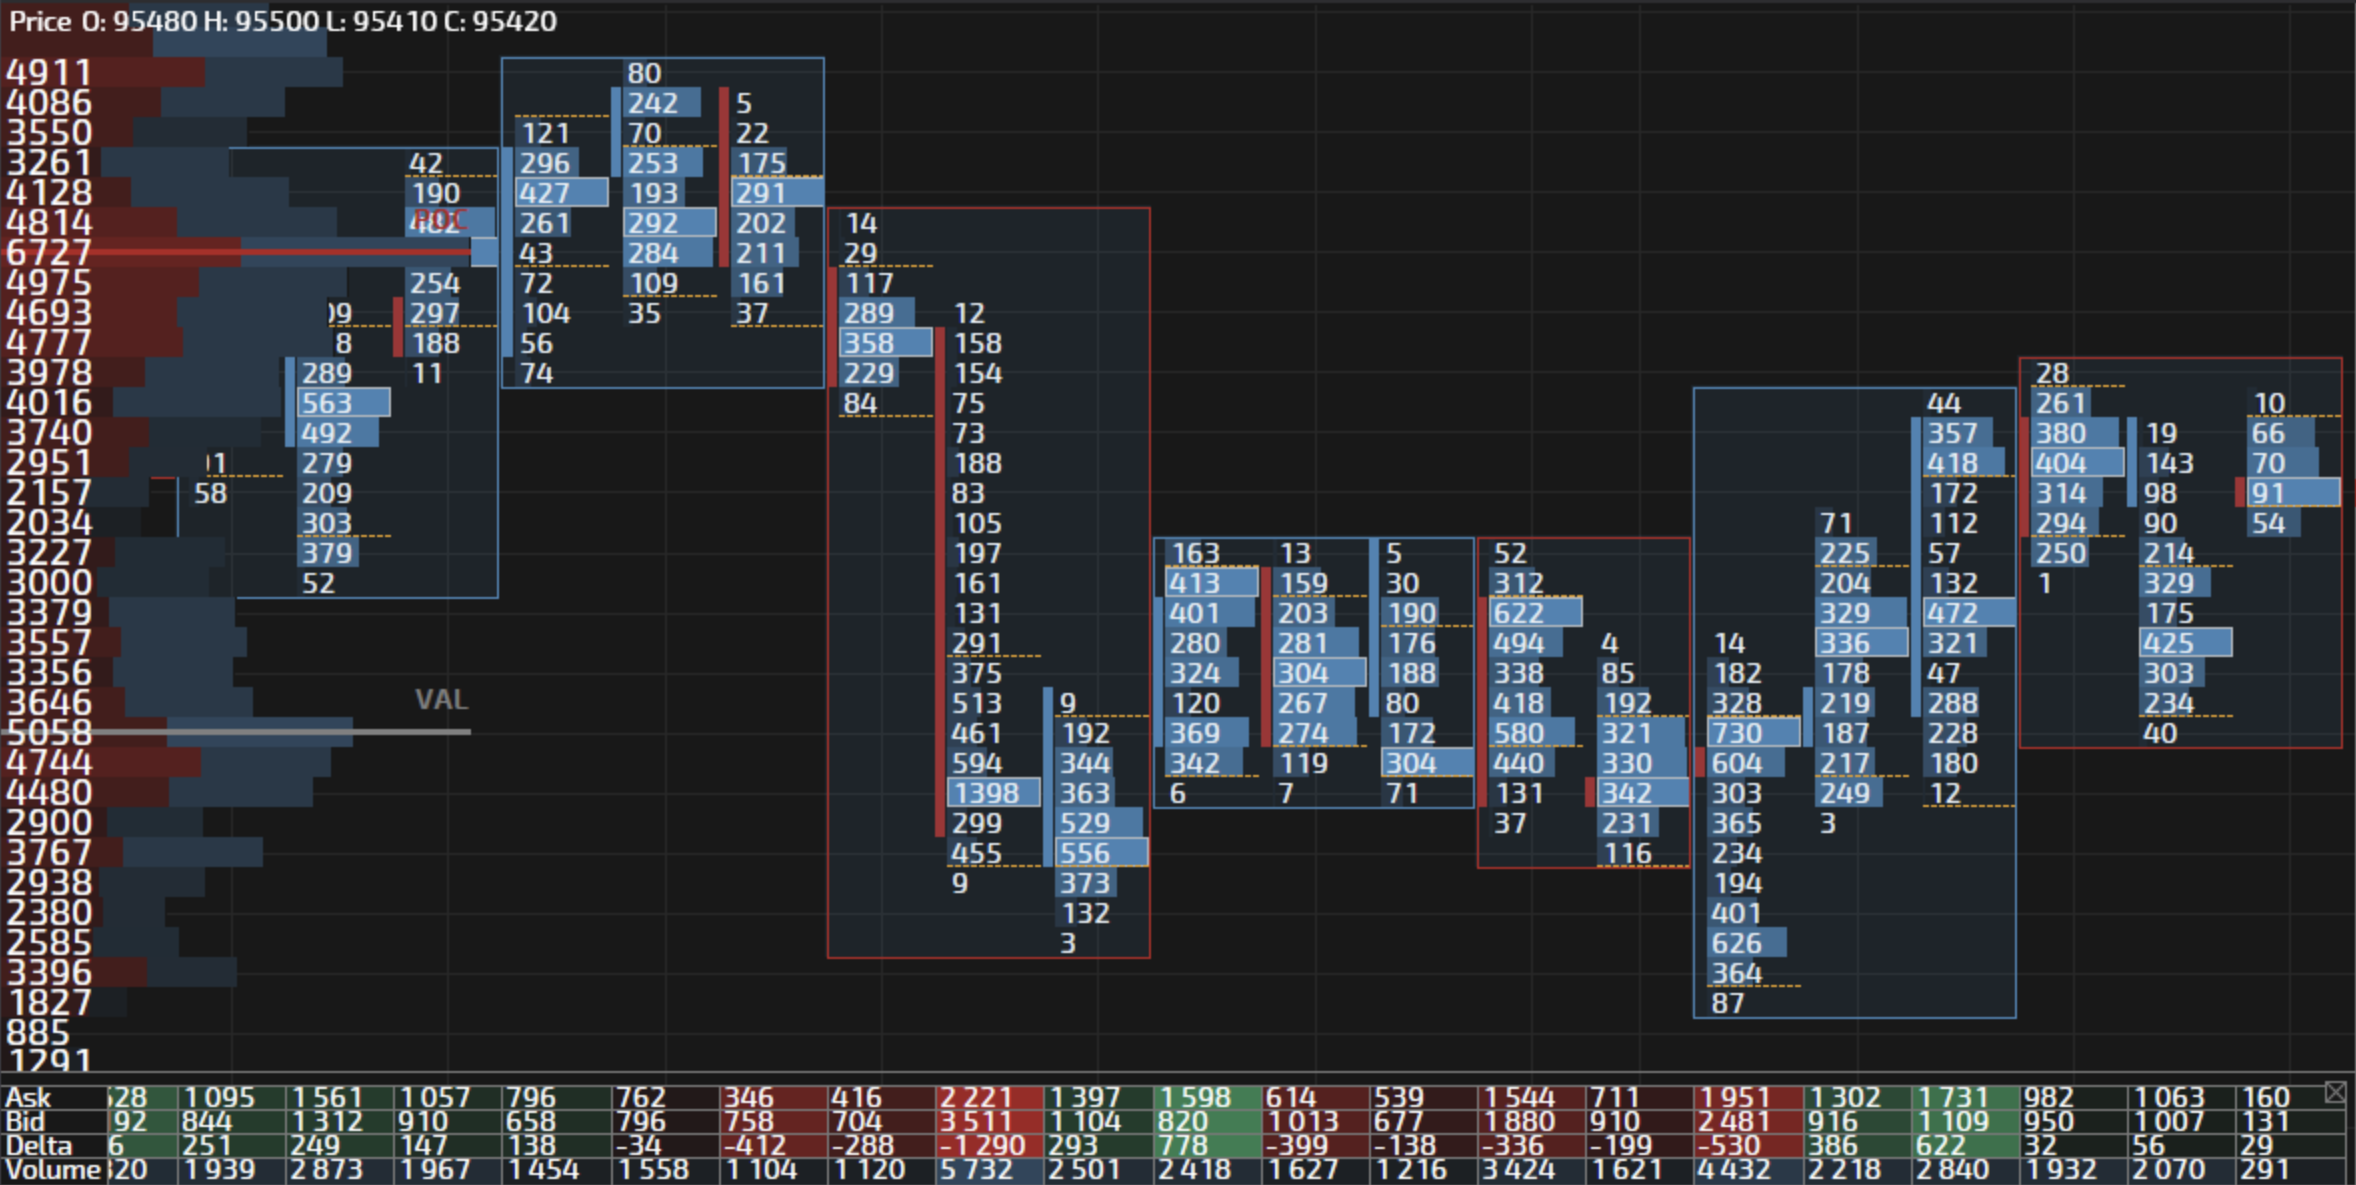
A cluster volume is an indicator associated with a price that helps to understand what the level of prices was the greatest interest in the formation of a candle. In essence, this is a mixture of vertical and horizontal volume indicators within one candle (period of time).
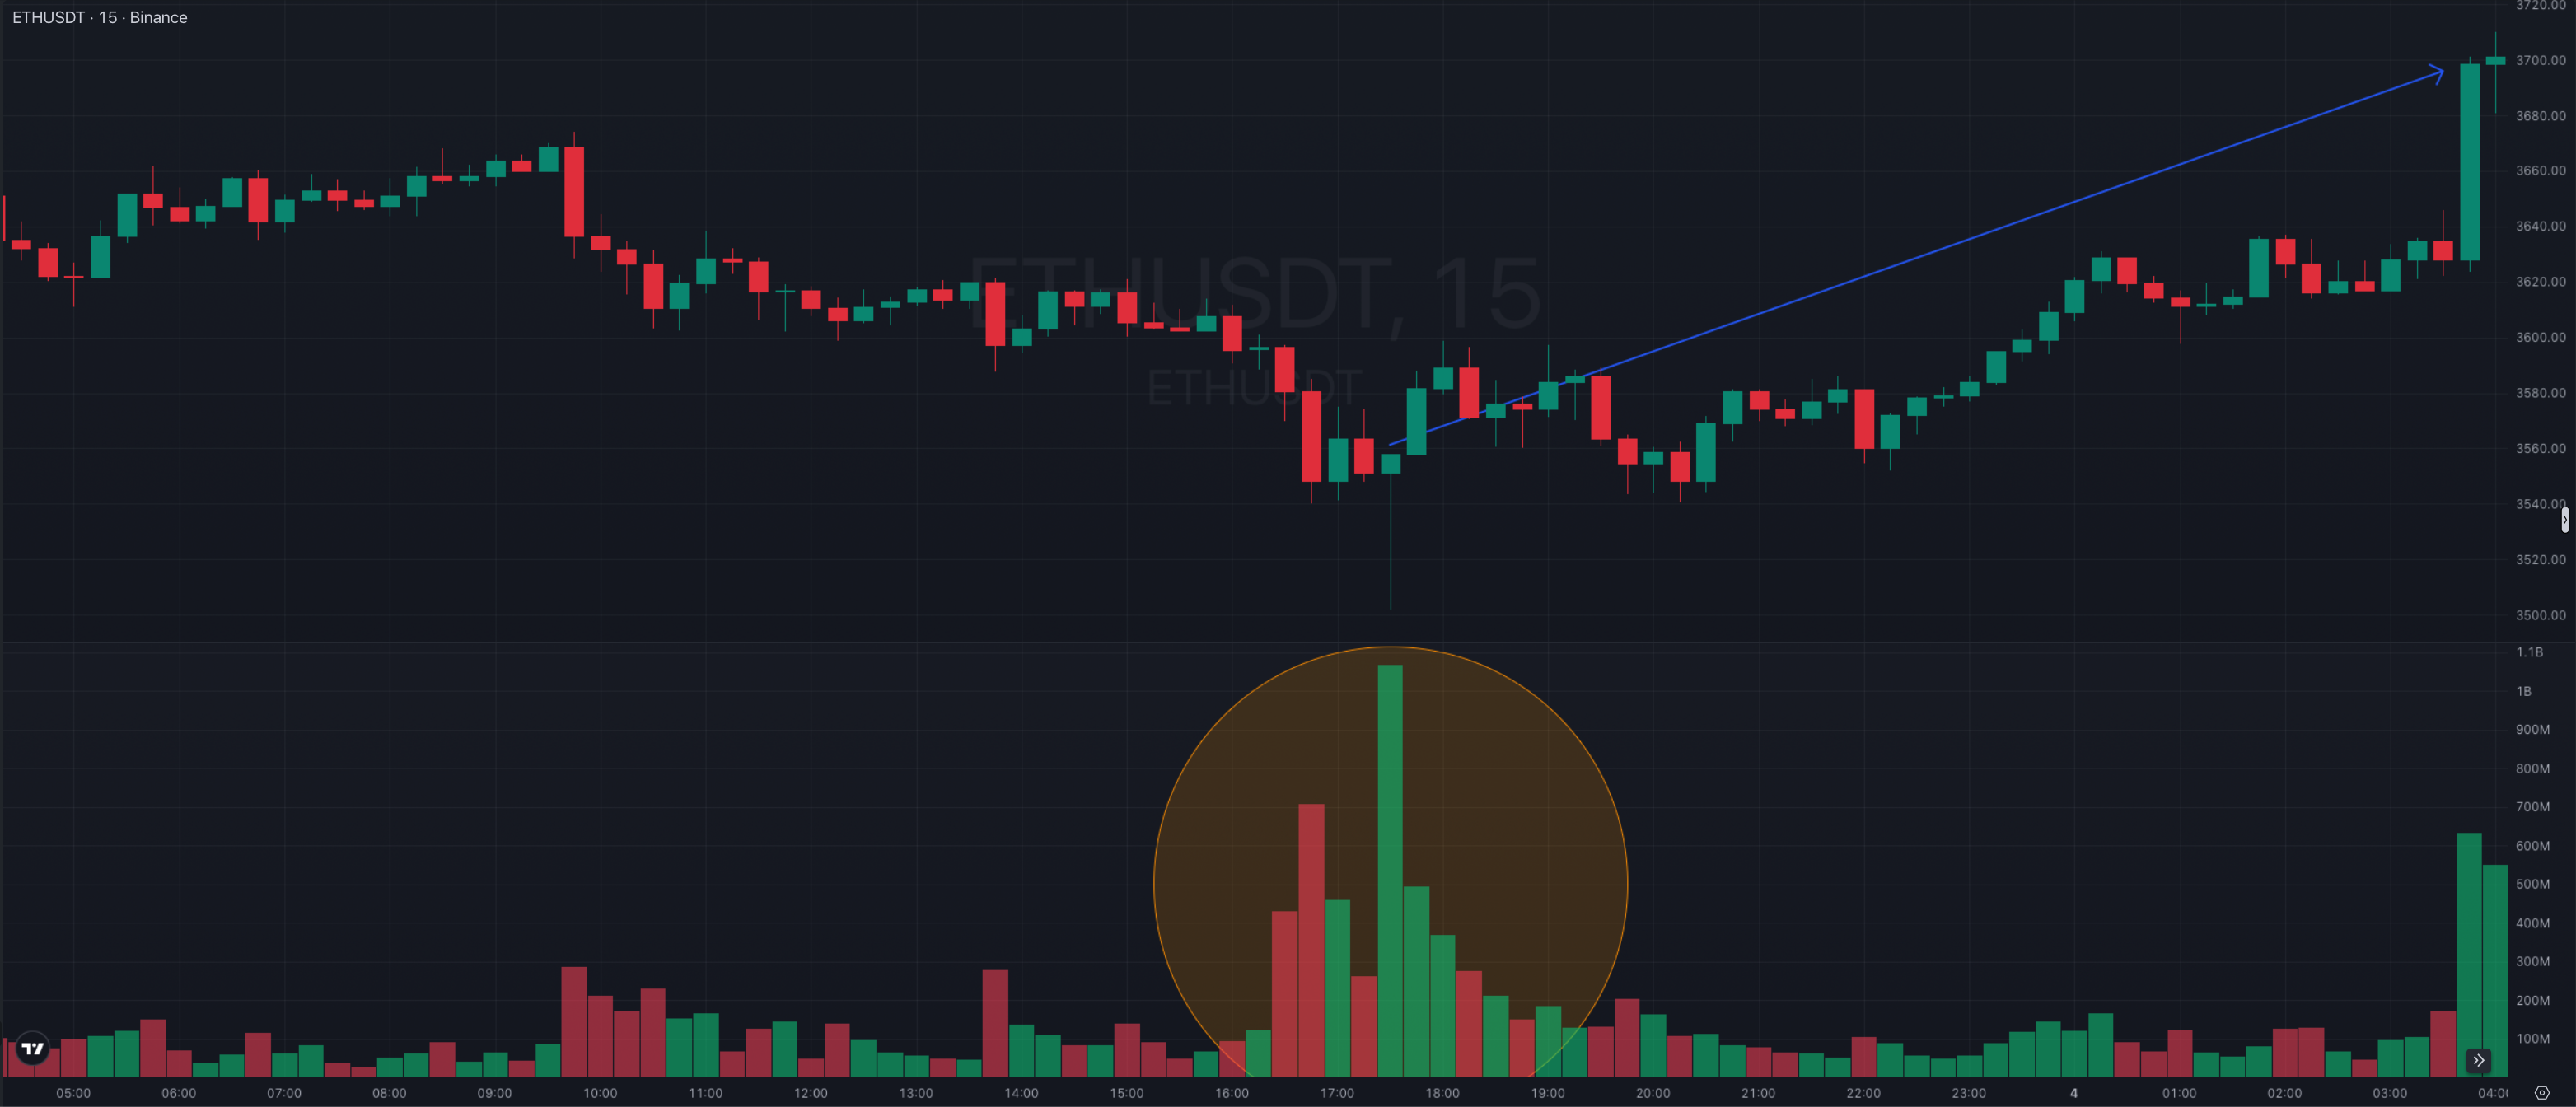
(from $3560 to $3700)
The volume growth itself does not provide accurate information about the price movement direction. However, together with other parameters, a fairly probable forecast can be made.
In the chart above (ETH/USDT, Binance exchange, 15-minute candles) you can see how a sharp increase in volumes changes the price trend. After the indicator decreases, you can see that the price holds the level and an upward trend begins to form. And this is already a good additional factor for considering the possibility of opening a long position.
The more data you have for analysis, the more accurate the forecast can be. And our project will try to help you by collecting maximum information in one place, so that it is convenient for you and your trading is as profitable and confident as possible.
Other Knowledge Base Articles
Understanding the 'why' behind a signal is just as important as the signal itself. Our Knowledge Base breaks down strategies for working with each market parameter.
Basic theory
The main parameters of the asset
What is Open Interest?
What is Price?
What is Liquidity?
What is Funding Rate?
About Our Screeners
Open Interest Screener
Pump and Dump Screener
Volume Screener
Custom Screener
Funding Screener
Soon