Main parameters of cryptocurrency
For futures, there are three main parameters that are worth paying attention to when analyzing. These are, of course, the price (the main one), open interest and trading volumes (or turnover, if we are talking about the volume of an asset in the base currency). Let’s consider how these parameters are related and how to analyze them correctly.
Cryptocurrency price
With the price parameter, everything is simple — it is the balance of supply and demand. As soon as demand for an asset begins to grow, the price also begins to increase. More and more people want to buy something more expensive than its market value, and this pushes the price up. Accordingly, if demand begins to fall, the price begins to fall. Sharp changes in price can occur at times when some large participant (buyer or seller) places a large order, thereby closing many counter orders.
About Price
Open interest
The open interest indicator is a unique parameter that exists only in futures trading (not only cryptocurrency). In simple terms, it is the sum of the open positions of all traders for a given contract. A high open interest rate indicates the interest of traders in a certain asset and literally means the amount of money that is currently in this contract.
About Open Interest
Trading Volume
This is the sum of closed positions. In essence, this is a continuation of the open interest plus the remaining liquidity: the sum of closed positions and liquidations. Trading turnover is like the situation on the battlefield after the battle. By analyzing it, you can understand how serious the battles were.
About Volume
How are these parameters related?
Despite the complexity of market movements, there is a certain linear relationship between the main parameters that helps analyze and predict the direction in which the price will go.
Let’s simplify and imagine the following situation. There is a certain coin that is listed on the exchange in the futures contracts section. As soon as it becomes available for purchase and traders begin to open orders, the open interest rate begins to grow.
At this point, the price may not have time to react (since, for example, this currency has good liquidity and it covers it). But at some point, there is not enough liquidity for everyone and the price starts to move up. Some traders start to close orders, taking profits and then volumes start to grow. At the same time, other parameters can start to move in the other direction (especially if most of the orders are open for quick speculation).
That is, if you imagine a certain point zero, the first to grow is always the open interest indicator (that is why we recommend using the Open Interest Screener to open long trades). Then the price starts to grow. As the price grows, traders’ positions start to close and volumes start to grow.
(from $2 to $2.5)
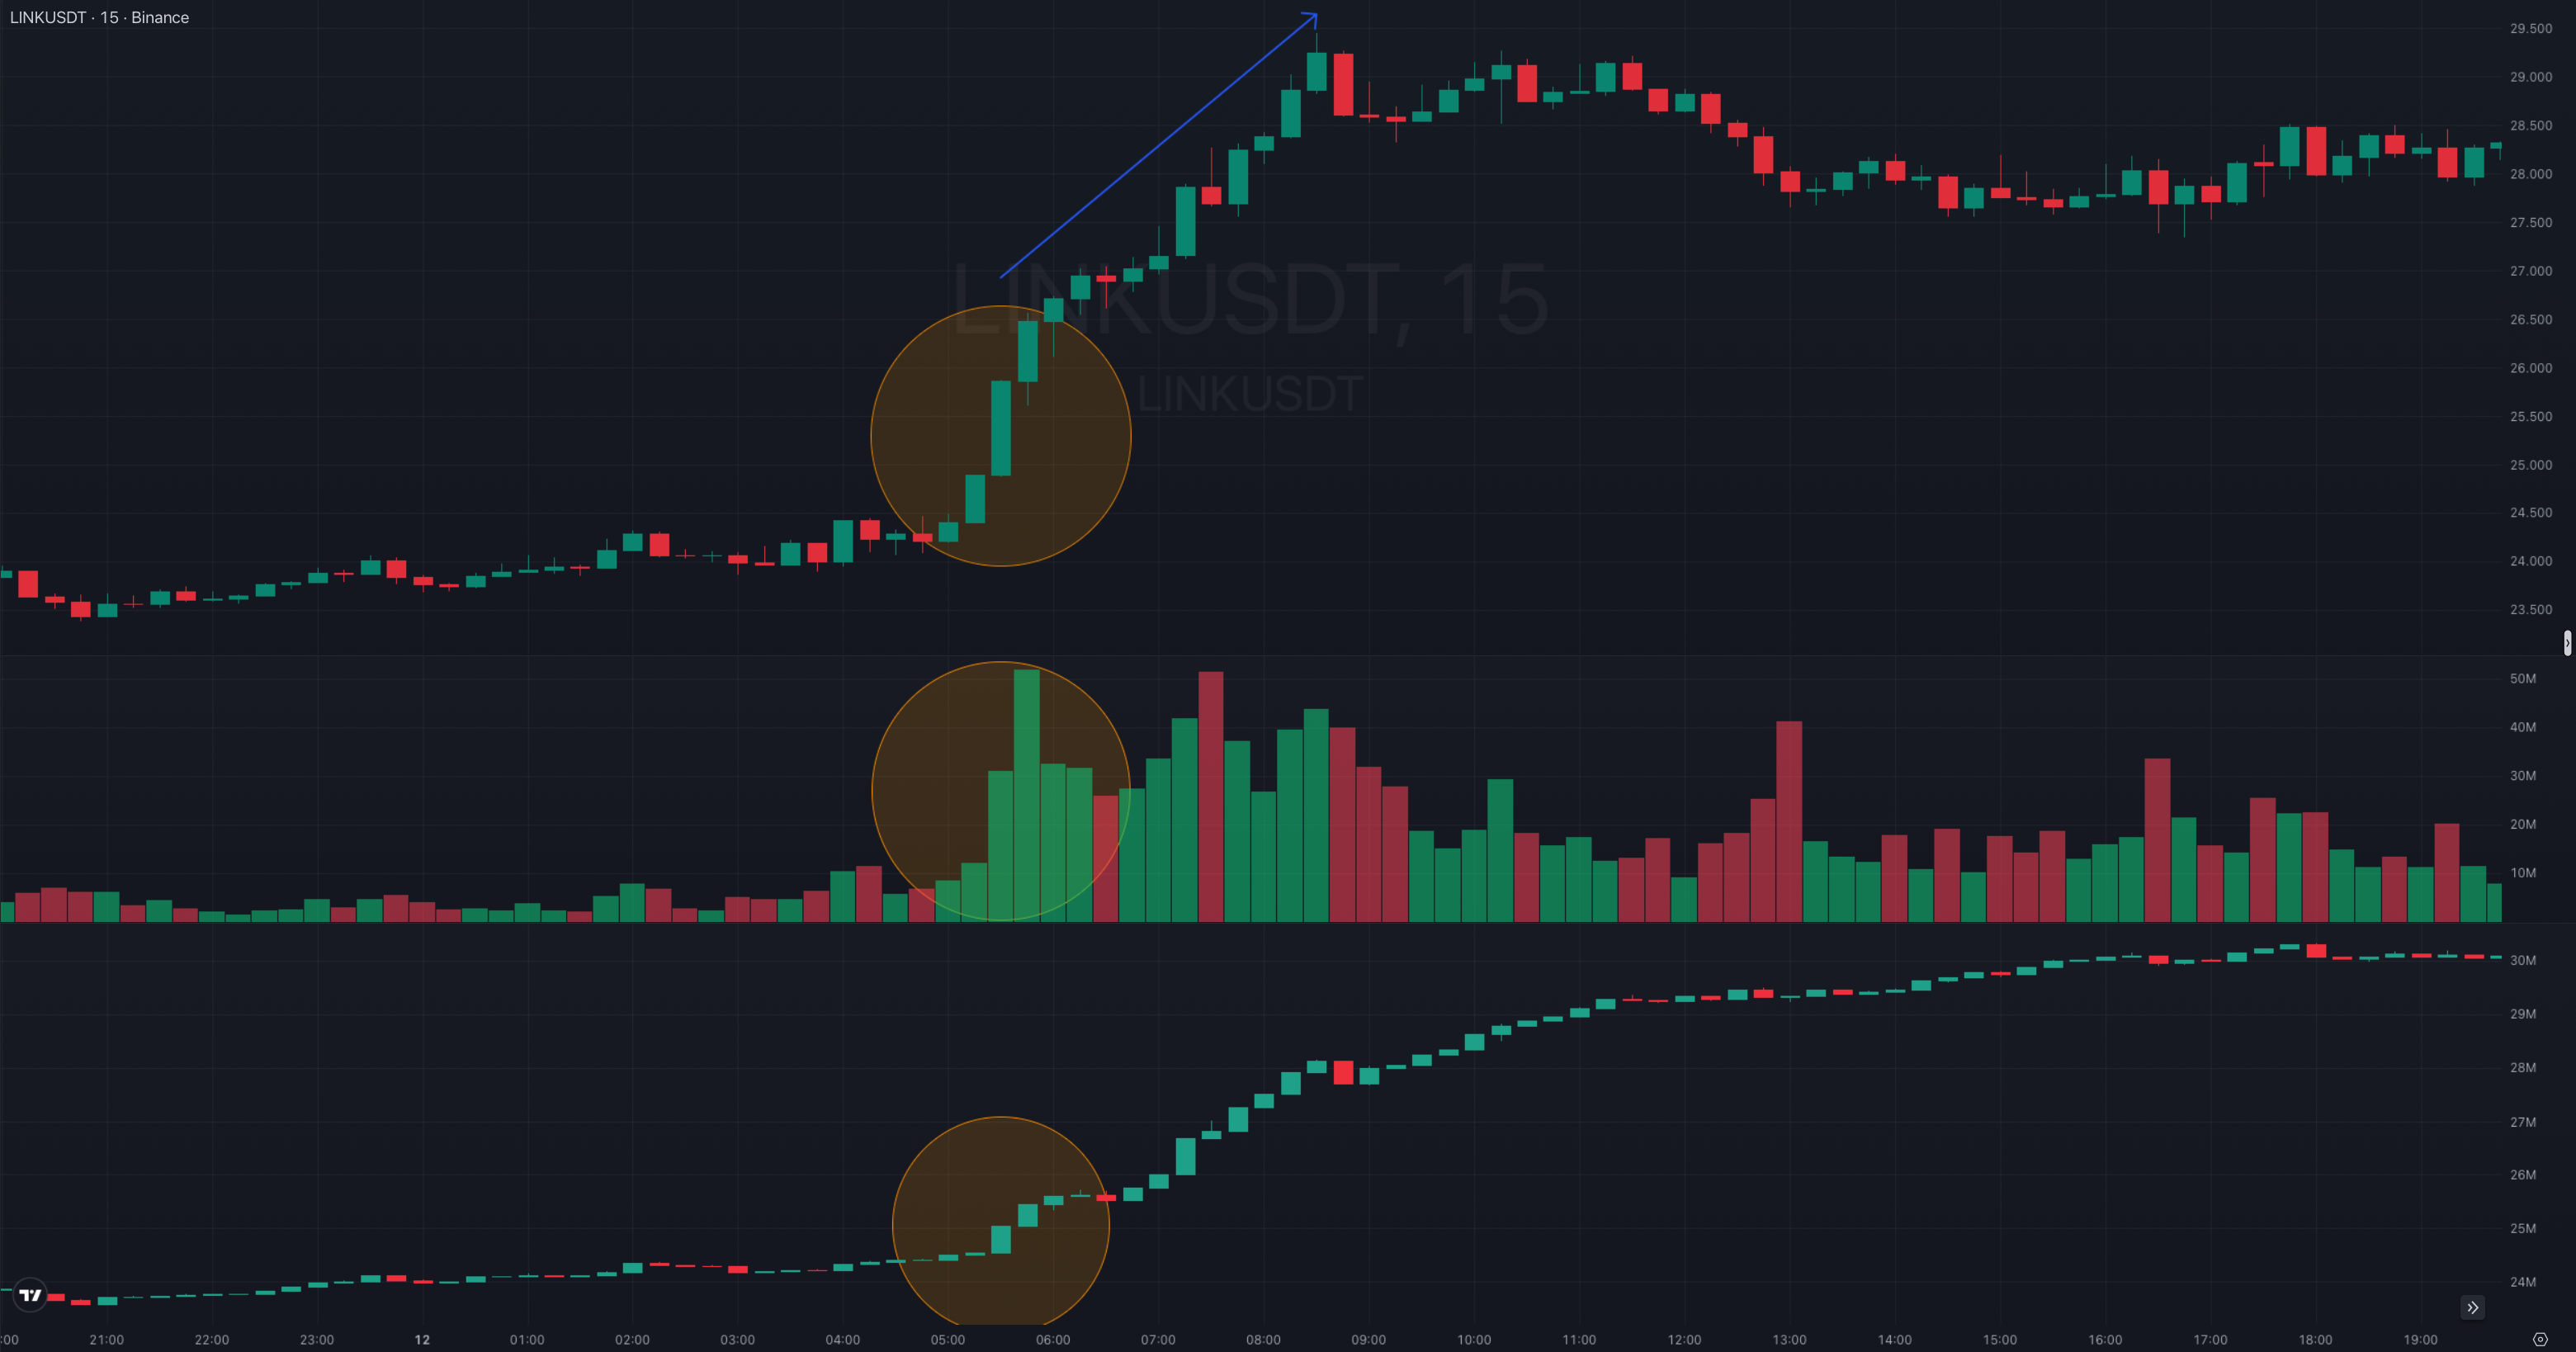
The chart above (XRP/USDT, Binance exchange, 15-minute candles) is a classic example of working with the open interest indicator. The situation before the sharp increase in OI: it changes slightly, there are no sharp movements, the general trend is downward, and the price moves sideways. Then there is a sharp increase in open interest (which means traders start opening many orders).
And since this is a leading indicator, the price starts to rise only after some time, during which you can analyze other parameters (price trend on other timeframes, determine levels and check volumes) and open a long position.
A universal recipe for a successful deal
Unfortunately, there is none. But it is important to understand the meaning of cryptocurrency parameters and try to feel the market so that the indicators in the terminal are not just numbers, but allow you to understand what is happening in the market.
Other Knowledge Base Articles
Understanding the 'why' behind a signal is just as important as the signal itself. Our Knowledge Base breaks down strategies for working with each market parameter.
Basic theory
What is Open Interest?
What is Price?
What is Trade Volume?
What is Liquidity?
What is Funding Rate?
About Our Screeners
Open Interest Screener
Pump and Dump Screener
Volume Screener
Custom Screener
Funding Screener
Soon