Why is open interest important for futures trading?
First, let’s figure out what open interest is. This term is applicable only to futures and means the sum of open positions of traders on a specific exchange. Moreover, there is no division into Long and Short positions. This is literally the sum of all positions for a certain coin.
So how can open interest analysis help in understanding the market situation and the price dynamics of a certain asset?
Analyzing Open Interest
First of all, you need to pay attention to the open interest size trend and the price trend. It is known that if demand for an asset begins to grow, the price begins to grow with it. This happens because buyers begin to dominate sellers and new participants are ready to buy the asset at a higher price, since there is not enough of it for everyone at the current price. This begins to accelerate the price until the number of sellers and buyers balances out or a large seller appears who is ready to sell a large amount of the asset at the current price, thereby satisfying the increased demand. At this point, the price growth stops and the movement in the opposite direction begins.
But the main danger here is the analysis of open interest without taking into account other indicators. Imagine the situation. The market experiences a collapse in the value of some asset (against a negative news background or simply because some large player sells a large volume) and immediately after the sale, the open interest indicator drops sharply. This is the closing of long positions of overly optimistic traders who enter the deal late, believing that the price will continue to grow. After collecting liquidity (closed long positions), you can observe the growth of open interest. And here are two main traps with insufficient analysis: firstly, the «low base» effect occurs (this is when some indicator is at low values and even a small increase relative to the base value shows a good increase in percentage), and secondly, this growth of open interest indicates that traders are starting to open short positions, hoping to earn money on the fall.
Here you can see the main advantage of working with open interest. Even though the growth of open interest does not always indicate the dominance of buyers and future price growth (remember that the OI indicator is the sum of short and long positions), this indicator often works ahead of the curve. That is, first, open interest begins to grow (for example, when traders begin to open long positions), and only then does the price growth follow.
Increase of OI + Increase in volumes and price = bullish trend. This means that market participants are optimistic, and the price of the asset will grow, as new participants with long positions appear.
Decrease of OI + Decrease in volumes and price decrease = is also a sign of a bullish trend.
Now let's get to practice
Pay attention to the upward trend of the open interest indicator. It can be assumed that market participants are slowly gaining a position on the coin. Perhaps they know something or are simply optimistic in anticipation of some news. This is accompanied by a slight increase in price, but what do we see next? At some point, a large amount of new money starts to enter the asset, which sharply moves the price up. But at this point, traders who have been slowly building up their position already have trades open at a lower price and they just need to wait for the moment when the pressure from buyers begins to weaken in order to sell the asset at the highest possible price. Which is what happens. And as can be seen from the sharp decrease in volumes and open interest, this brings the price down, an avalanche-like closing of long positions of participants who entered the deal too late. The asset’s liquidity is collected, which is taken by these early traders.
It is also important to understand that the open interest indicator is formed on each exchange. In this case, using data aggregators (such as Coinglass or Coinmarketcap) for analysis can play a cruel joke. In addition to the fact that the open interest value is received by aggregators with a delay, aggregators simply summarize the indicators from different exchanges to form a general picture of the market. And a situation may arise when a sharp increase in open positions (and, accordingly, an increase in open interest) begins on some exchange, but this does not affect the value of the asset, since its volumes on this exchange are small and, despite the relative growth, do not affect the price.
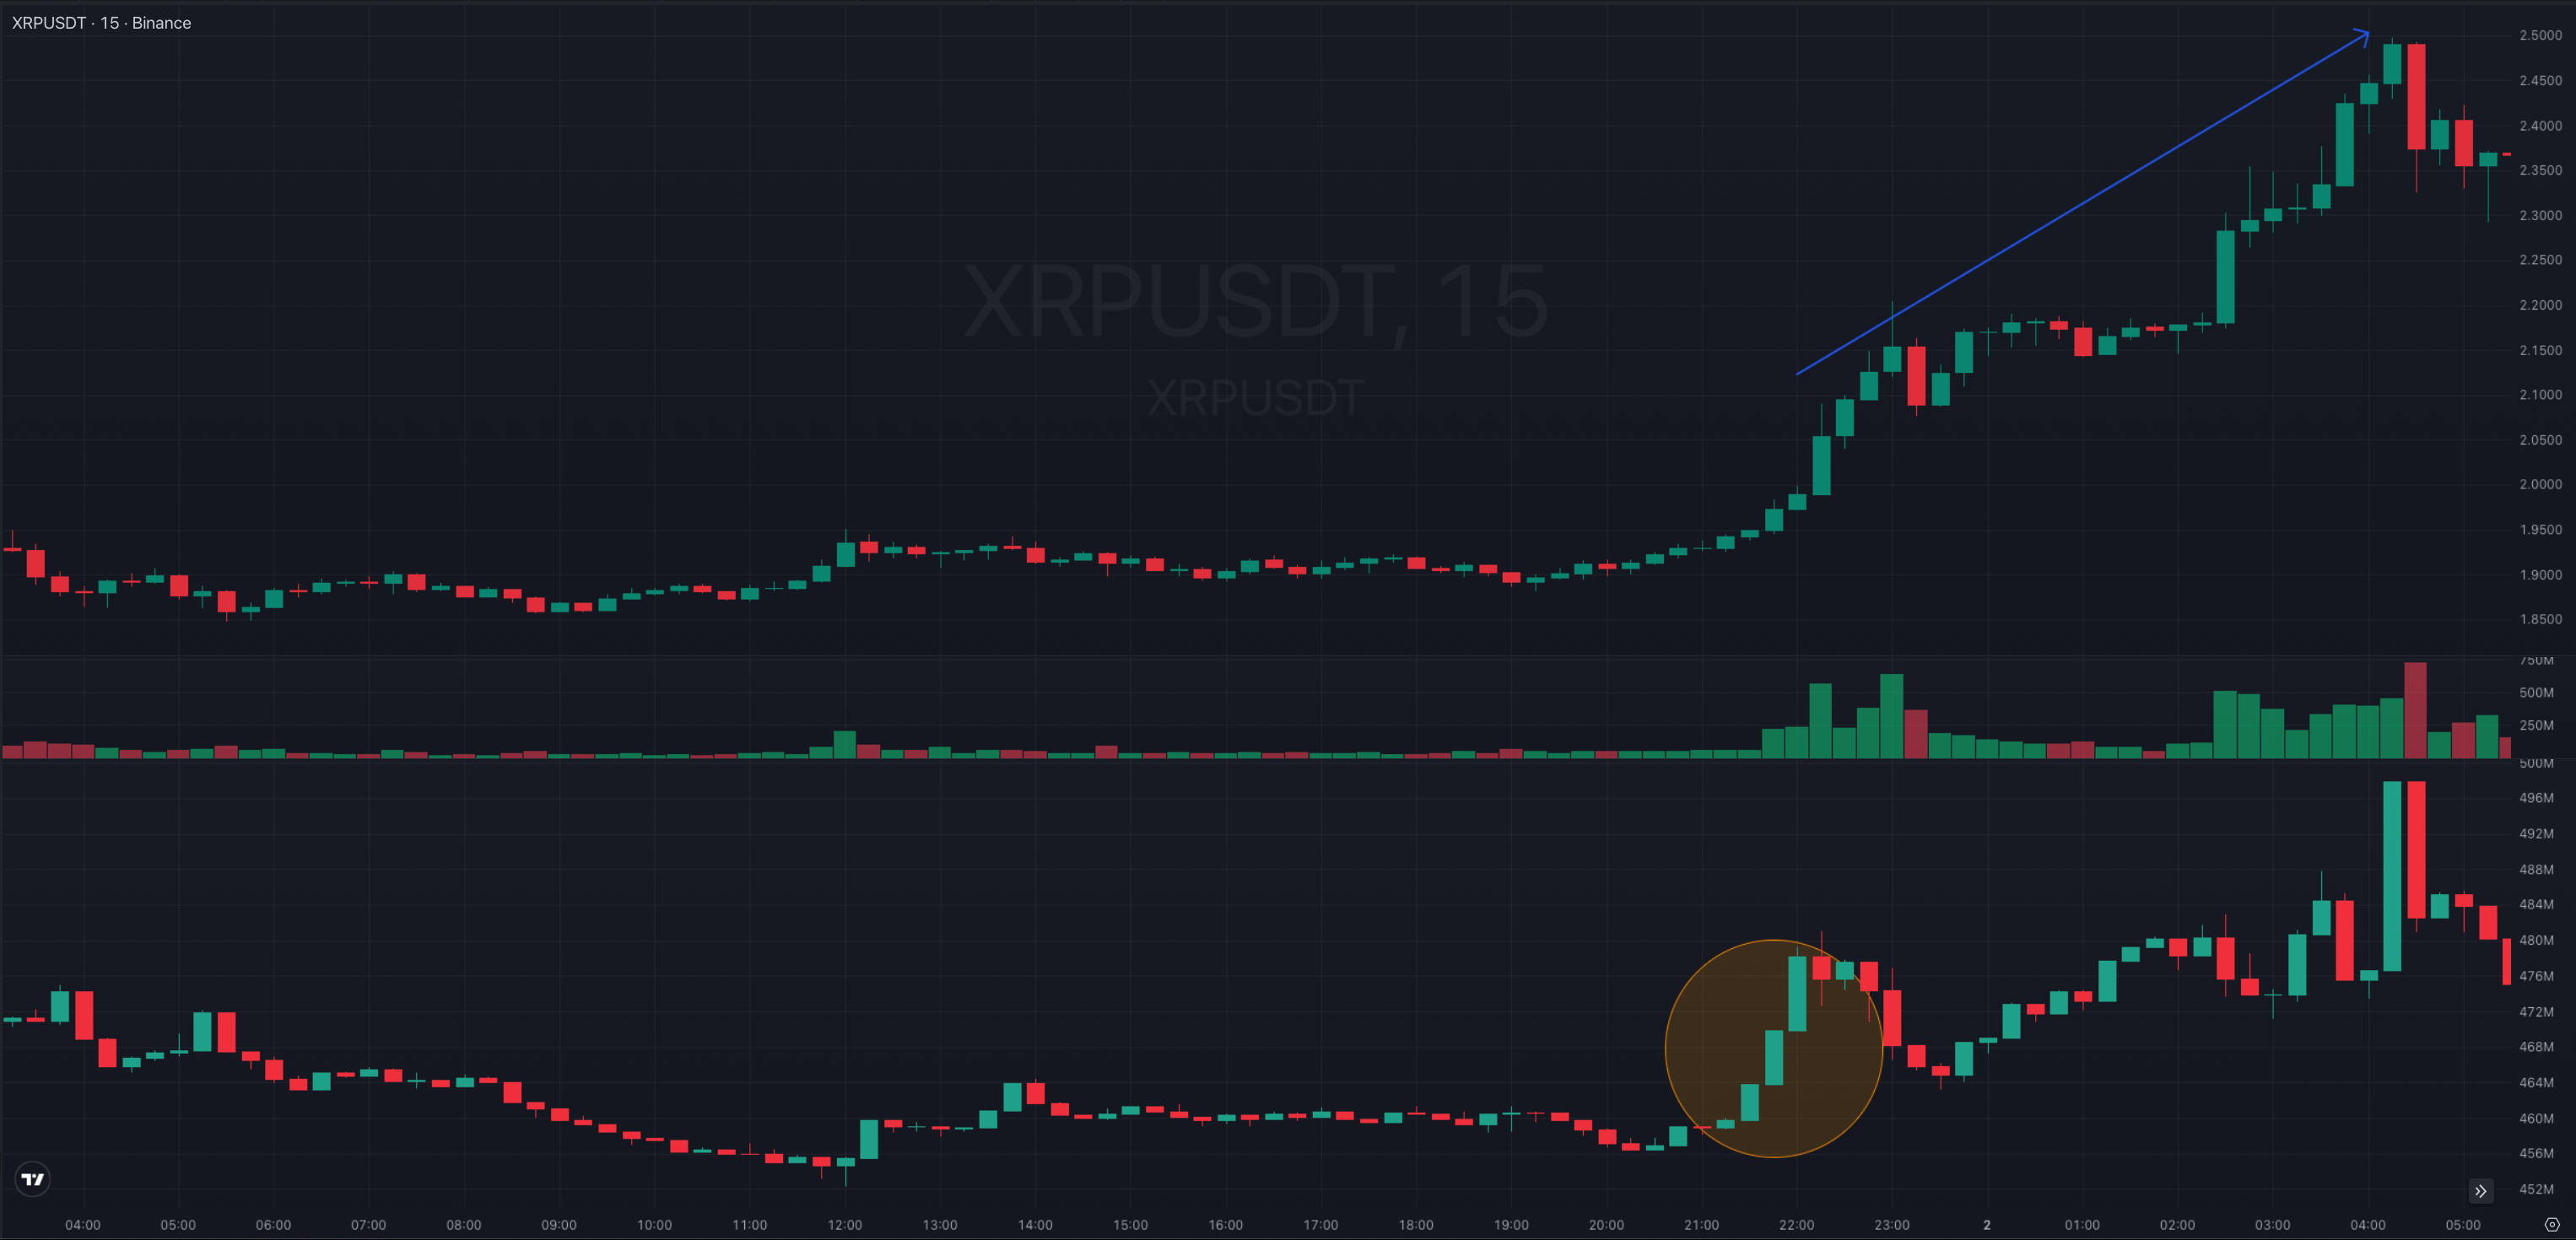
(from $2 to $2.5)
The chart above (XRP/USDT, Binance exchange, 15-minute candles) is a classic example of working with the open interest indicator. The situation before the sharp increase in OI: it changes slightly, there are no sharp movements, the general trend is downward, and the price moves sideways. Then there is a sharp increase in open interest (which means traders start opening many orders).
And since this is a leading indicator, the price starts to rise only after some time, during which you can analyze other parameters (price trend on other timeframes, determine levels and check volumes) and open a long position.
Therefore, it is important to analyze the open interest indicator on a specific exchange. Our screener receives fresh data every minute and saves it for subsequent analysis, while aggregators receive historical data (which are based on 15-minute candles), which leads to a delay. And a delay in receiving data in trading can lead to incorrect trading decisions.
Other Knowledge Base Articles
Understanding the 'why' behind a signal is just as important as the signal itself. Our Knowledge Base breaks down strategies for working with each market parameter.
Basic theory
The main parameters of the asset
What is Price?
What is Trade Volume?
What is Liquidity?
What is Funding Rate?
About Our Screeners
Open Interest Screener
Pump and Dump Screener
Volume Screener
Custom Screener
Funding Screener
Soon